Intermediate programming with R
Creating subplots with facets
Learning Objectives
- Create subplots for each level of a factor using
facet_wrap - Create subplots for each level of a factor using
facet_grid
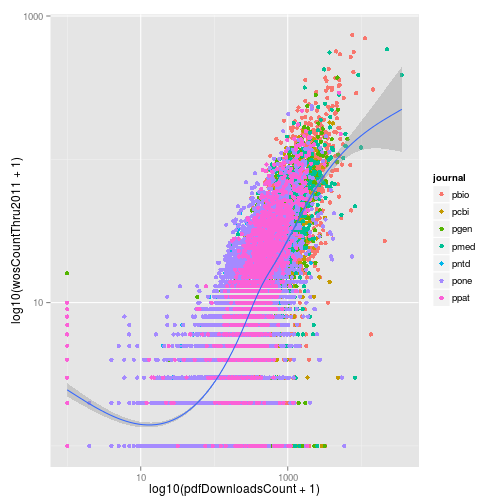
In our plot of the 2011 citations versus number of PDF downloads, we colored the points according to the journal where the article was published. However this was not very informative because the the points overlapped substantially. In order to compare across journals, it would be better to create a separate subplot for each journal.
p <- ggplot(research, aes(x = log10(pdfDownloadsCount + 1),
                          y = log10(wosCountThru2011 + 1))) +
  geom_point(aes(color = journal)) +
  geom_smooth() +
  scale_x_continuous(breaks = c(1, 3), labels = c(10, 1000)) +
  scale_y_continuous(breaks = c(1, 3), labels = c(10, 1000))
p
geom_smooth: method="auto" and size of largest group is >=1000, so using gam with formula: y ~ s(x, bs = "cs"). Use 'method = x' to change the smoothing method.

facet_wrap
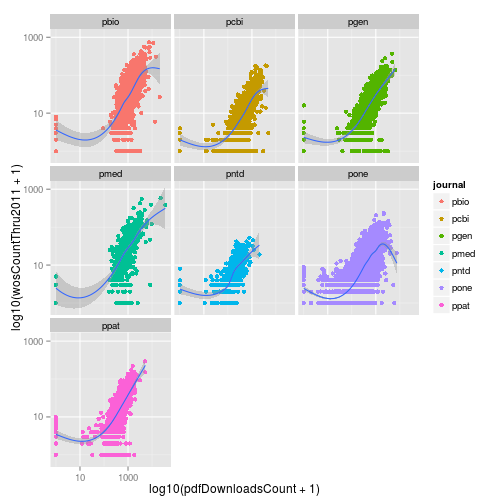
We can accomplish this with the function facet_wrap. We specify the name of the column after a tilde ~, and a separate subplot is created for each level of the factor.
p + facet_wrap(~journal)geom_smooth: method="auto" and size of largest group is >=1000, so using gam with formula: y ~ s(x, bs = "cs"). Use 'method = x' to change the smoothing method.
geom_smooth: method="auto" and size of largest group is >=1000, so using gam with formula: y ~ s(x, bs = "cs"). Use 'method = x' to change the smoothing method.
geom_smooth: method="auto" and size of largest group is >=1000, so using gam with formula: y ~ s(x, bs = "cs"). Use 'method = x' to change the smoothing method.
geom_smooth: method="auto" and size of largest group is <1000, so using loess. Use 'method = x' to change the smoothing method.
geom_smooth: method="auto" and size of largest group is <1000, so using loess. Use 'method = x' to change the smoothing method.
geom_smooth: method="auto" and size of largest group is >=1000, so using gam with formula: y ~ s(x, bs = "cs"). Use 'method = x' to change the smoothing method.
geom_smooth: method="auto" and size of largest group is >=1000, so using gam with formula: y ~ s(x, bs = "cs"). Use 'method = x' to change the smoothing method.

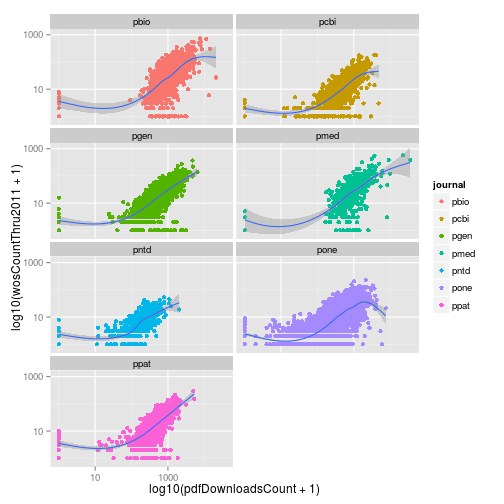
Furthermore, we can control the display of the output by specifying the number of rows and/or columns.
p + facet_wrap(~journal, ncol = 2)geom_smooth: method="auto" and size of largest group is >=1000, so using gam with formula: y ~ s(x, bs = "cs"). Use 'method = x' to change the smoothing method.
geom_smooth: method="auto" and size of largest group is >=1000, so using gam with formula: y ~ s(x, bs = "cs"). Use 'method = x' to change the smoothing method.
geom_smooth: method="auto" and size of largest group is >=1000, so using gam with formula: y ~ s(x, bs = "cs"). Use 'method = x' to change the smoothing method.
geom_smooth: method="auto" and size of largest group is <1000, so using loess. Use 'method = x' to change the smoothing method.
geom_smooth: method="auto" and size of largest group is <1000, so using loess. Use 'method = x' to change the smoothing method.
geom_smooth: method="auto" and size of largest group is >=1000, so using gam with formula: y ~ s(x, bs = "cs"). Use 'method = x' to change the smoothing method.
geom_smooth: method="auto" and size of largest group is >=1000, so using gam with formula: y ~ s(x, bs = "cs"). Use 'method = x' to change the smoothing method.

Also notice that since there are 7 different plots, there are now seven different loess curves.
facet_grid
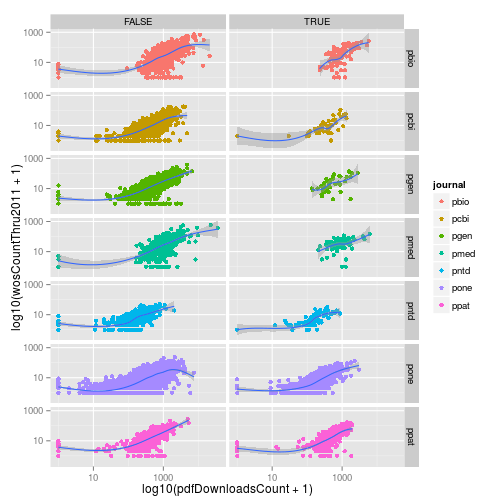
If we have two categorical variables to facet, we use the function facet_grid. First let’s create a new column that is a logical vector for whether or not the article has the PLOS subject tag “Immunology”.
research <- mutate(research, immuno = grepl("Immunology", plosSubjectTags))With facet_grid, we first specify the factor for the rows and second the factor for the columns.
#p + facet_grid(journal~immuno)This failed because we updated the data frame research with the new column immuno, but we never updated p with the new data. Let’s redefine p and then add use facet_grid.
p <- ggplot(research, aes(x = log10(pdfDownloadsCount + 1), y = log10(wosCountThru2011 + 1))) +
  geom_point(aes(color = journal)) +
  geom_smooth() +
  scale_x_continuous(breaks = c(1, 3), labels = c(10, 1000)) +
  scale_y_continuous(breaks = c(1, 3), labels = c(10, 1000))
p + facet_grid(journal~immuno)
geom_smooth: method="auto" and size of largest group is >=1000, so using gam with formula: y ~ s(x, bs = "cs"). Use 'method = x' to change the smoothing method.
geom_smooth: method="auto" and size of largest group is <1000, so using loess. Use 'method = x' to change the smoothing method.
geom_smooth: method="auto" and size of largest group is >=1000, so using gam with formula: y ~ s(x, bs = "cs"). Use 'method = x' to change the smoothing method.
geom_smooth: method="auto" and size of largest group is <1000, so using loess. Use 'method = x' to change the smoothing method.
geom_smooth: method="auto" and size of largest group is >=1000, so using gam with formula: y ~ s(x, bs = "cs"). Use 'method = x' to change the smoothing method.
geom_smooth: method="auto" and size of largest group is <1000, so using loess. Use 'method = x' to change the smoothing method.
geom_smooth: method="auto" and size of largest group is <1000, so using loess. Use 'method = x' to change the smoothing method.
geom_smooth: method="auto" and size of largest group is <1000, so using loess. Use 'method = x' to change the smoothing method.
geom_smooth: method="auto" and size of largest group is <1000, so using loess. Use 'method = x' to change the smoothing method.
geom_smooth: method="auto" and size of largest group is <1000, so using loess. Use 'method = x' to change the smoothing method.
geom_smooth: method="auto" and size of largest group is >=1000, so using gam with formula: y ~ s(x, bs = "cs"). Use 'method = x' to change the smoothing method.
geom_smooth: method="auto" and size of largest group is >=1000, so using gam with formula: y ~ s(x, bs = "cs"). Use 'method = x' to change the smoothing method.
geom_smooth: method="auto" and size of largest group is >=1000, so using gam with formula: y ~ s(x, bs = "cs"). Use 'method = x' to change the smoothing method.
geom_smooth: method="auto" and size of largest group is <1000, so using loess. Use 'method = x' to change the smoothing method.

Challenge
Using facets
Add another variable to research called evolution, which is a logical vector indicating if the article has the PLOS subject tag “Evolutionary Biology”. Use facet_grid to create subplots based on the variables evolution and immuno.
